
Multi-Location Analytics Platform
Every location on one screen. Live.
Butler Performance Analytics turns raw point-of-sale data into a live command center for multi-location operators — sales, transactions, average ticket, labor and discounts across every location, updated automatically.
The challenge
A multi-location operator is flying blind. Every location's numbers live inside a point-of-sale system, in reports nobody has time to pull, and by the time a bad week shows up in the monthly spreadsheet it's already over. Comparing a dozen locations means a dozen logins, a dozen exports and a pile of manual math — so the questions that matter (which location is slipping? where's labor creeping? who's discounting too hard?) go unanswered until it's too late to act.
What we built
Butler Performance Analytics (BPA) — a premium, multi-location service-intelligence platform that turns raw POS data into a single live command center:
- A secure in-network sync agent that reads the operator's POS data read-only and pushes it to the cloud nightly — no database exposed, no sensitive data leaving on-prem unprotected
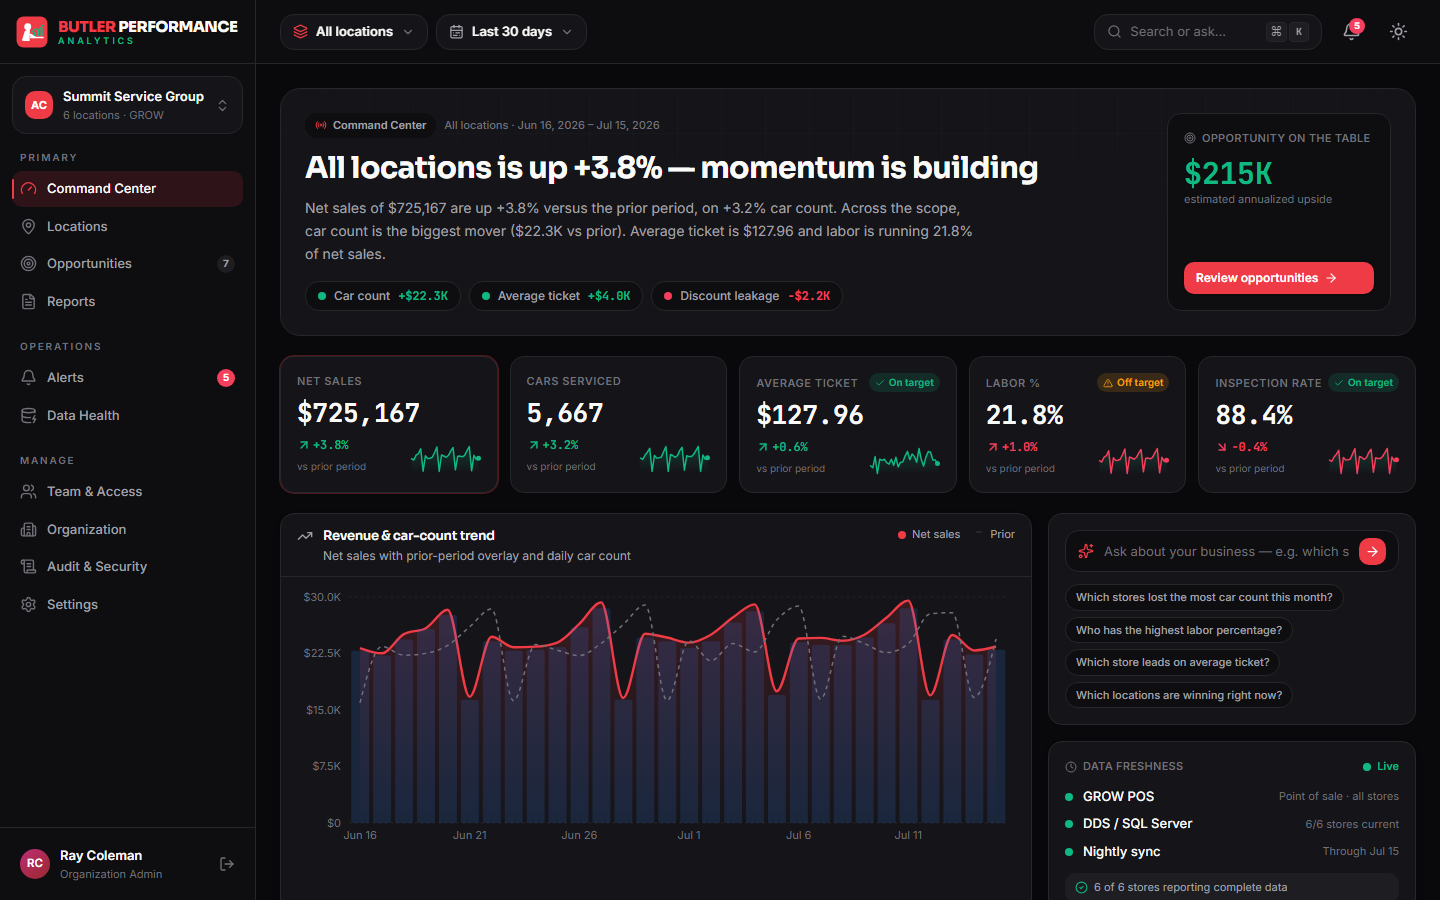
- A live command center with the KPIs that actually run the business: net sales, transactions, average ticket, labor percentage and discounts — per location, per district, org-wide
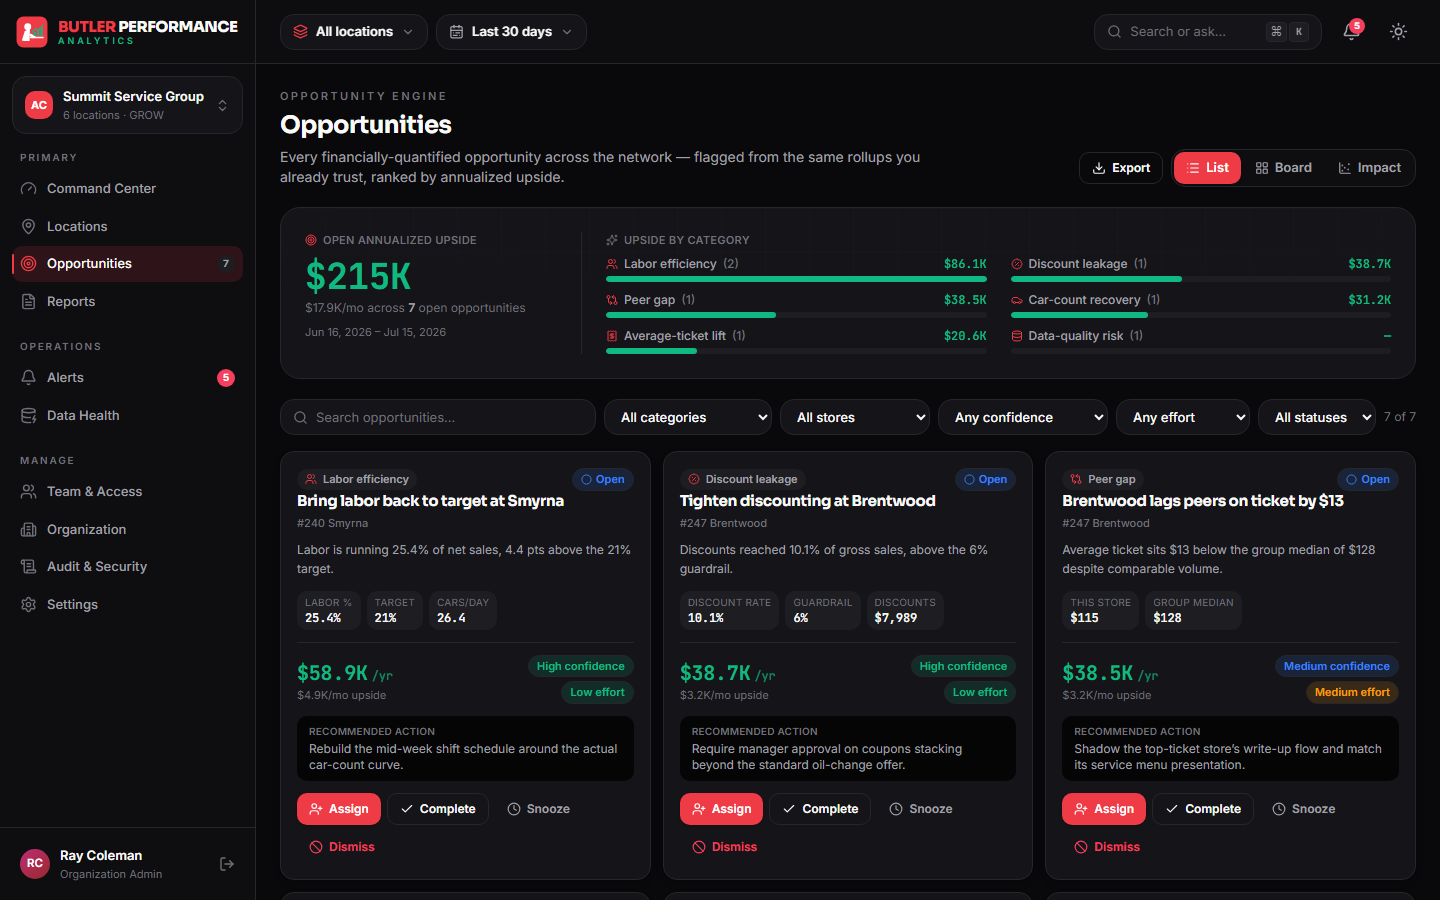
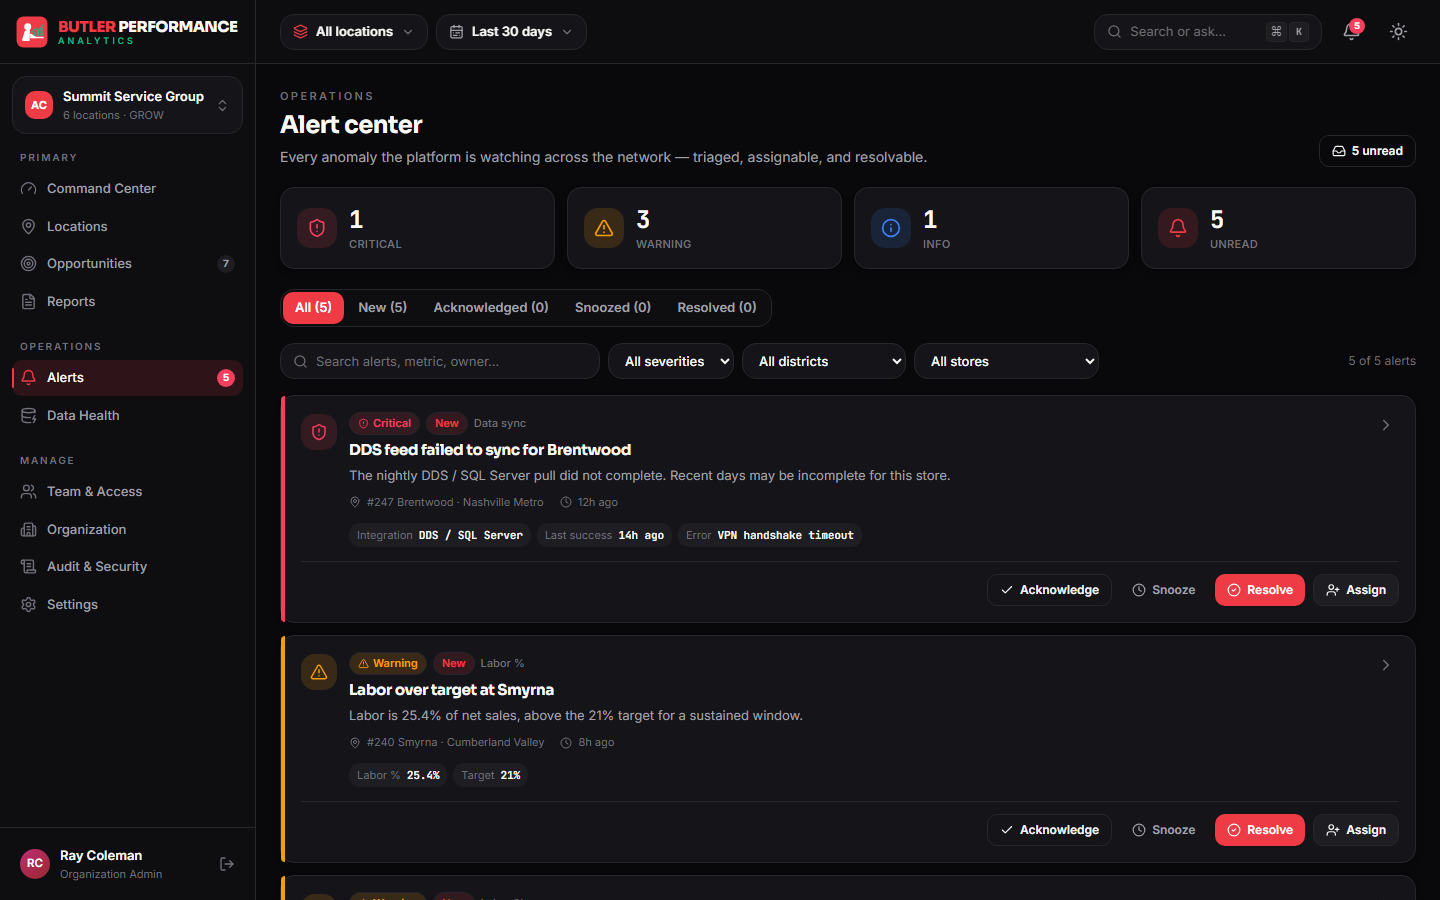
- Opportunities & alerts that surface the location or trend that needs attention, instead of waiting for a monthly review
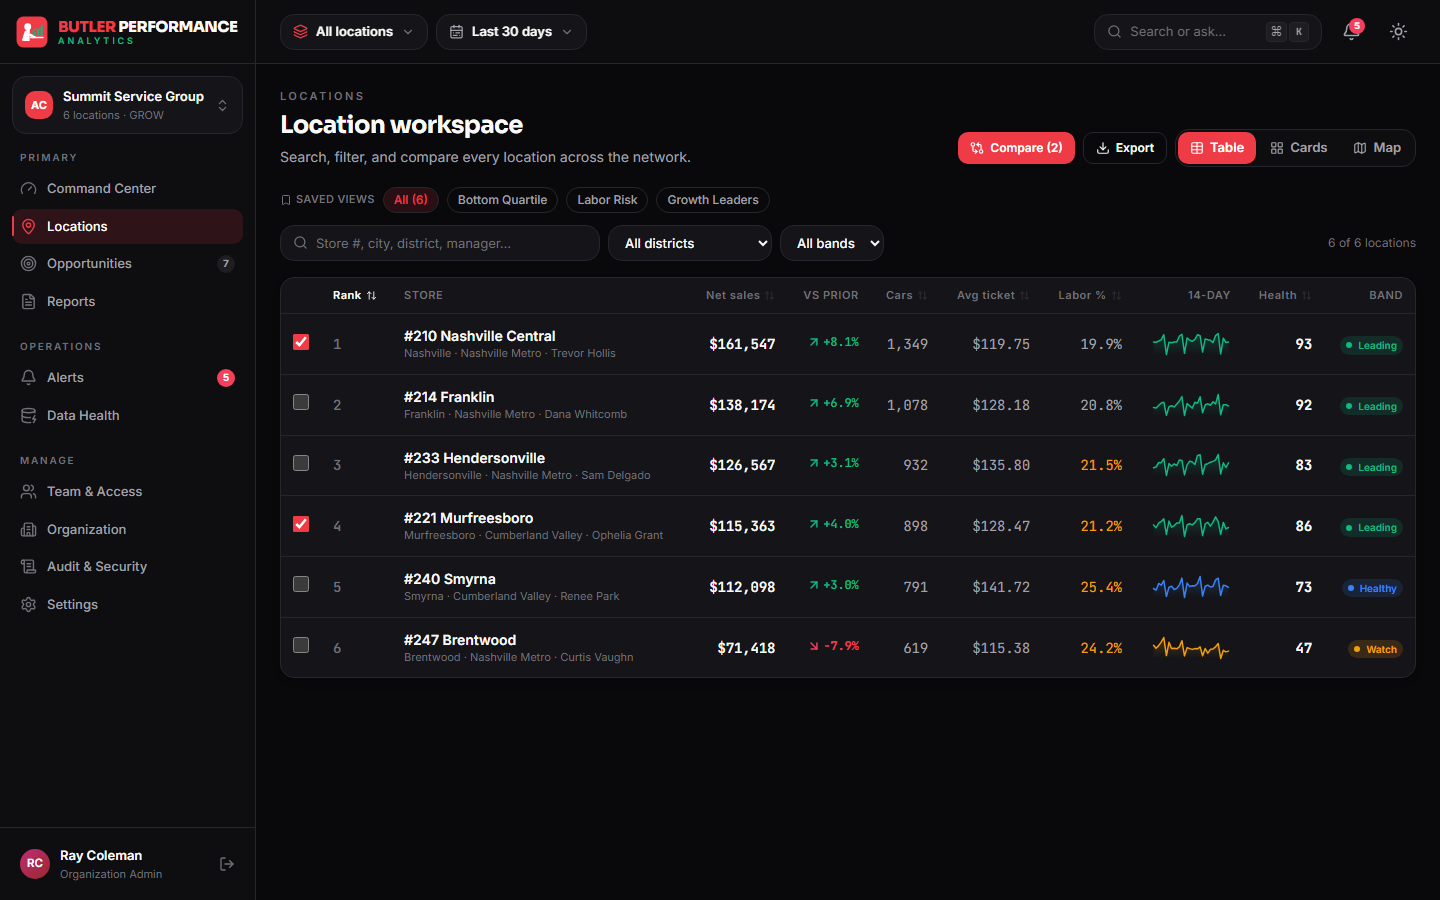
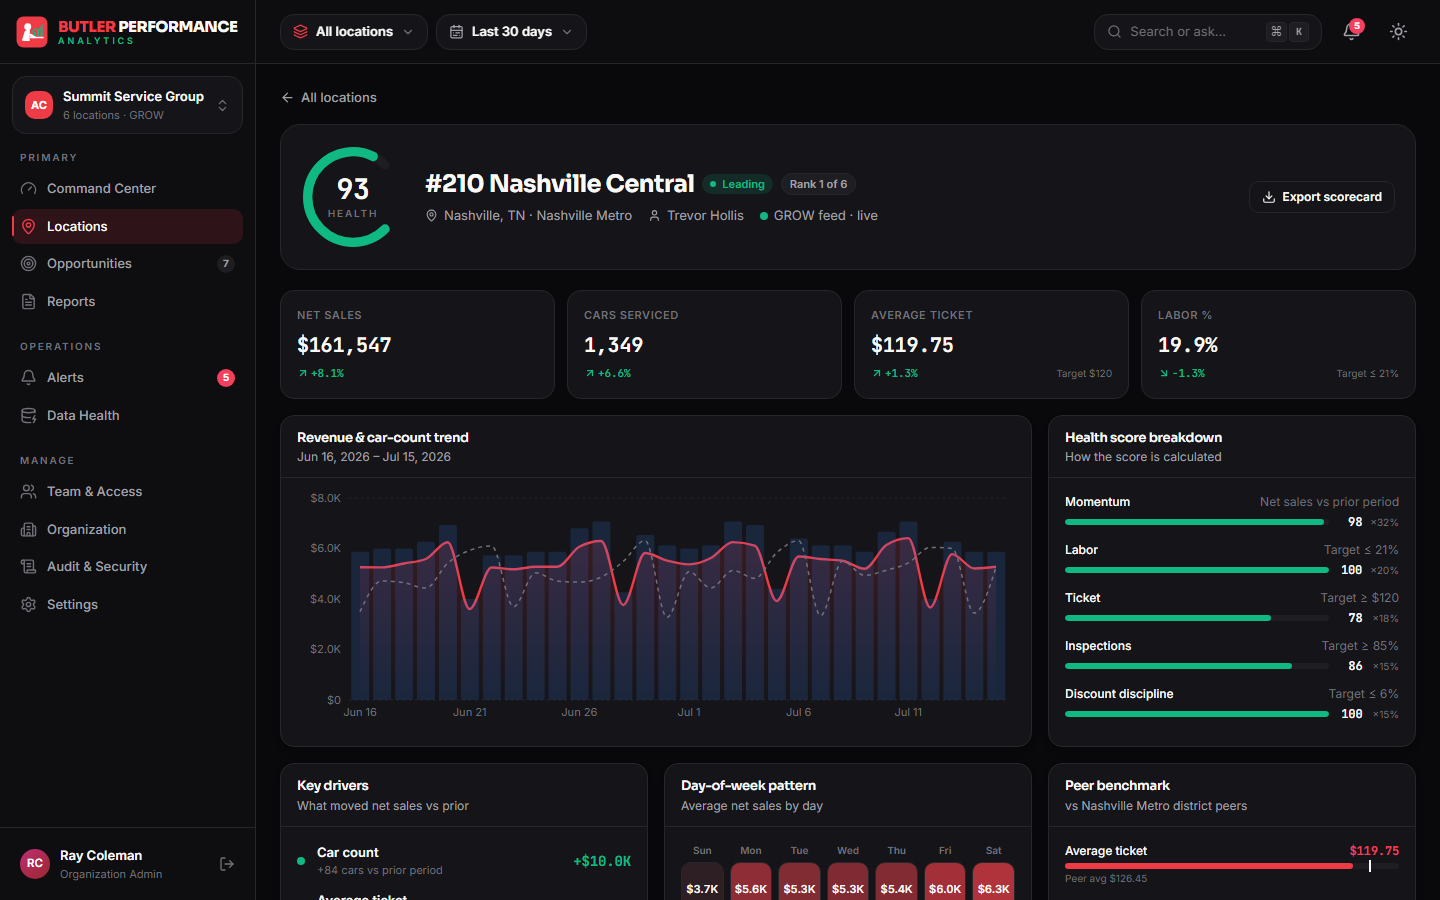
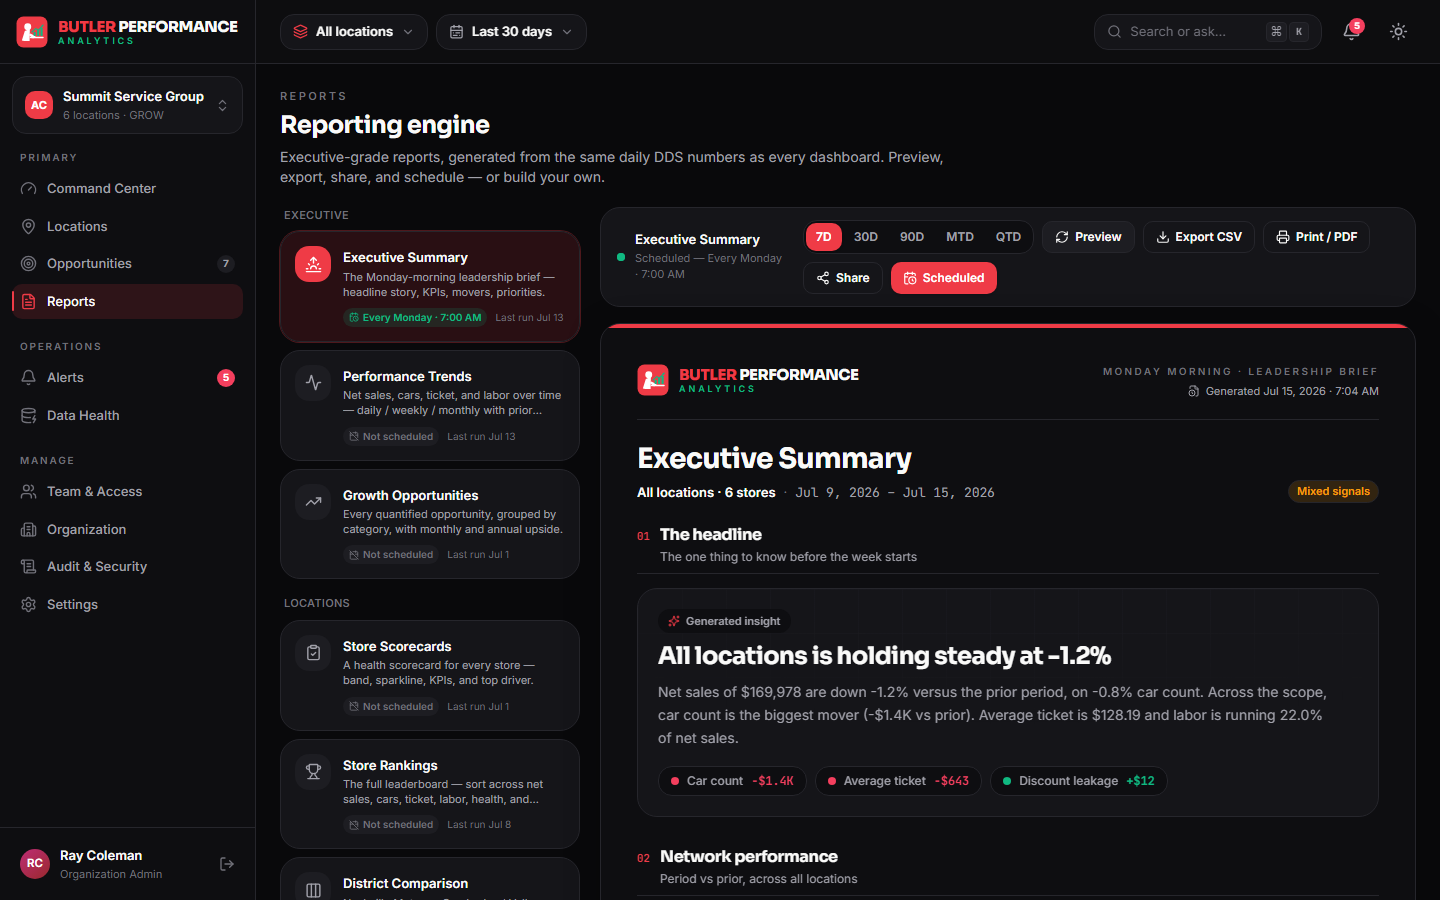
- A full reporting suite — executive summaries, performance trends, location scorecards, rankings and day-of-week analysis — print- and export-ready
- Role-based access so an owner sees everything, a district manager sees their district, and a location manager sees their location
- Real login, JWT auth and a live audit log — built to handle real financial data responsibly
The result
Every location on one screen, updated automatically — the operator opens one platform and immediately sees how the whole group is running, where the money's leaking and which location needs a call today. It's proof of what we build when a business has outgrown spreadsheets: a custom dashboard and platform engineered around how the operation actually makes money — not another report nobody reads.
BPA is the flagship example of the data automation and custom-platform work we bring to every engagement — whatever the industry.
See it in action
A walkthrough of the live platform, shown with sample data from a fictional multi-location operator — a client's real numbers are never shown publicly.
What we'd build for you.
Let's build something better.
Tell us what's slowing the business down. We'll tell you what we'd build to fix it.